When organizations purchase software, they aren’t just purchasing software for their immediate needs, but also for their needs years down the road. The software must be able to grow and evolve with the client… and the client needs to be able to increase their level of maturity with the software platform and its capabilities. Marketo Measure is no different in this regard. However, unless the client’s marketing team is very sophisticated with marketing attribution and analytics, it can be difficult to see that maturity path. So, we’ve developed a Marketo Measure Maturity Model to help clients see that maturity path and understand how to navigate it. The Maturity Model includes four stages; Foundation Building, Scaling, Aligning, and Mastering. And, we’ve mapped those stages across four key measures; Data Curation/Creation, Data Customization, Reporting Capabilities, and Reporting Sophistication. Clients can use this Maturity Model to identify where they are strong and where they have areas for growth, and then focus on those specific areas. This will help clients continue to get more and more out of their Marketo Measure purchase and ensure that they are achieving their long-term goals with the platform.
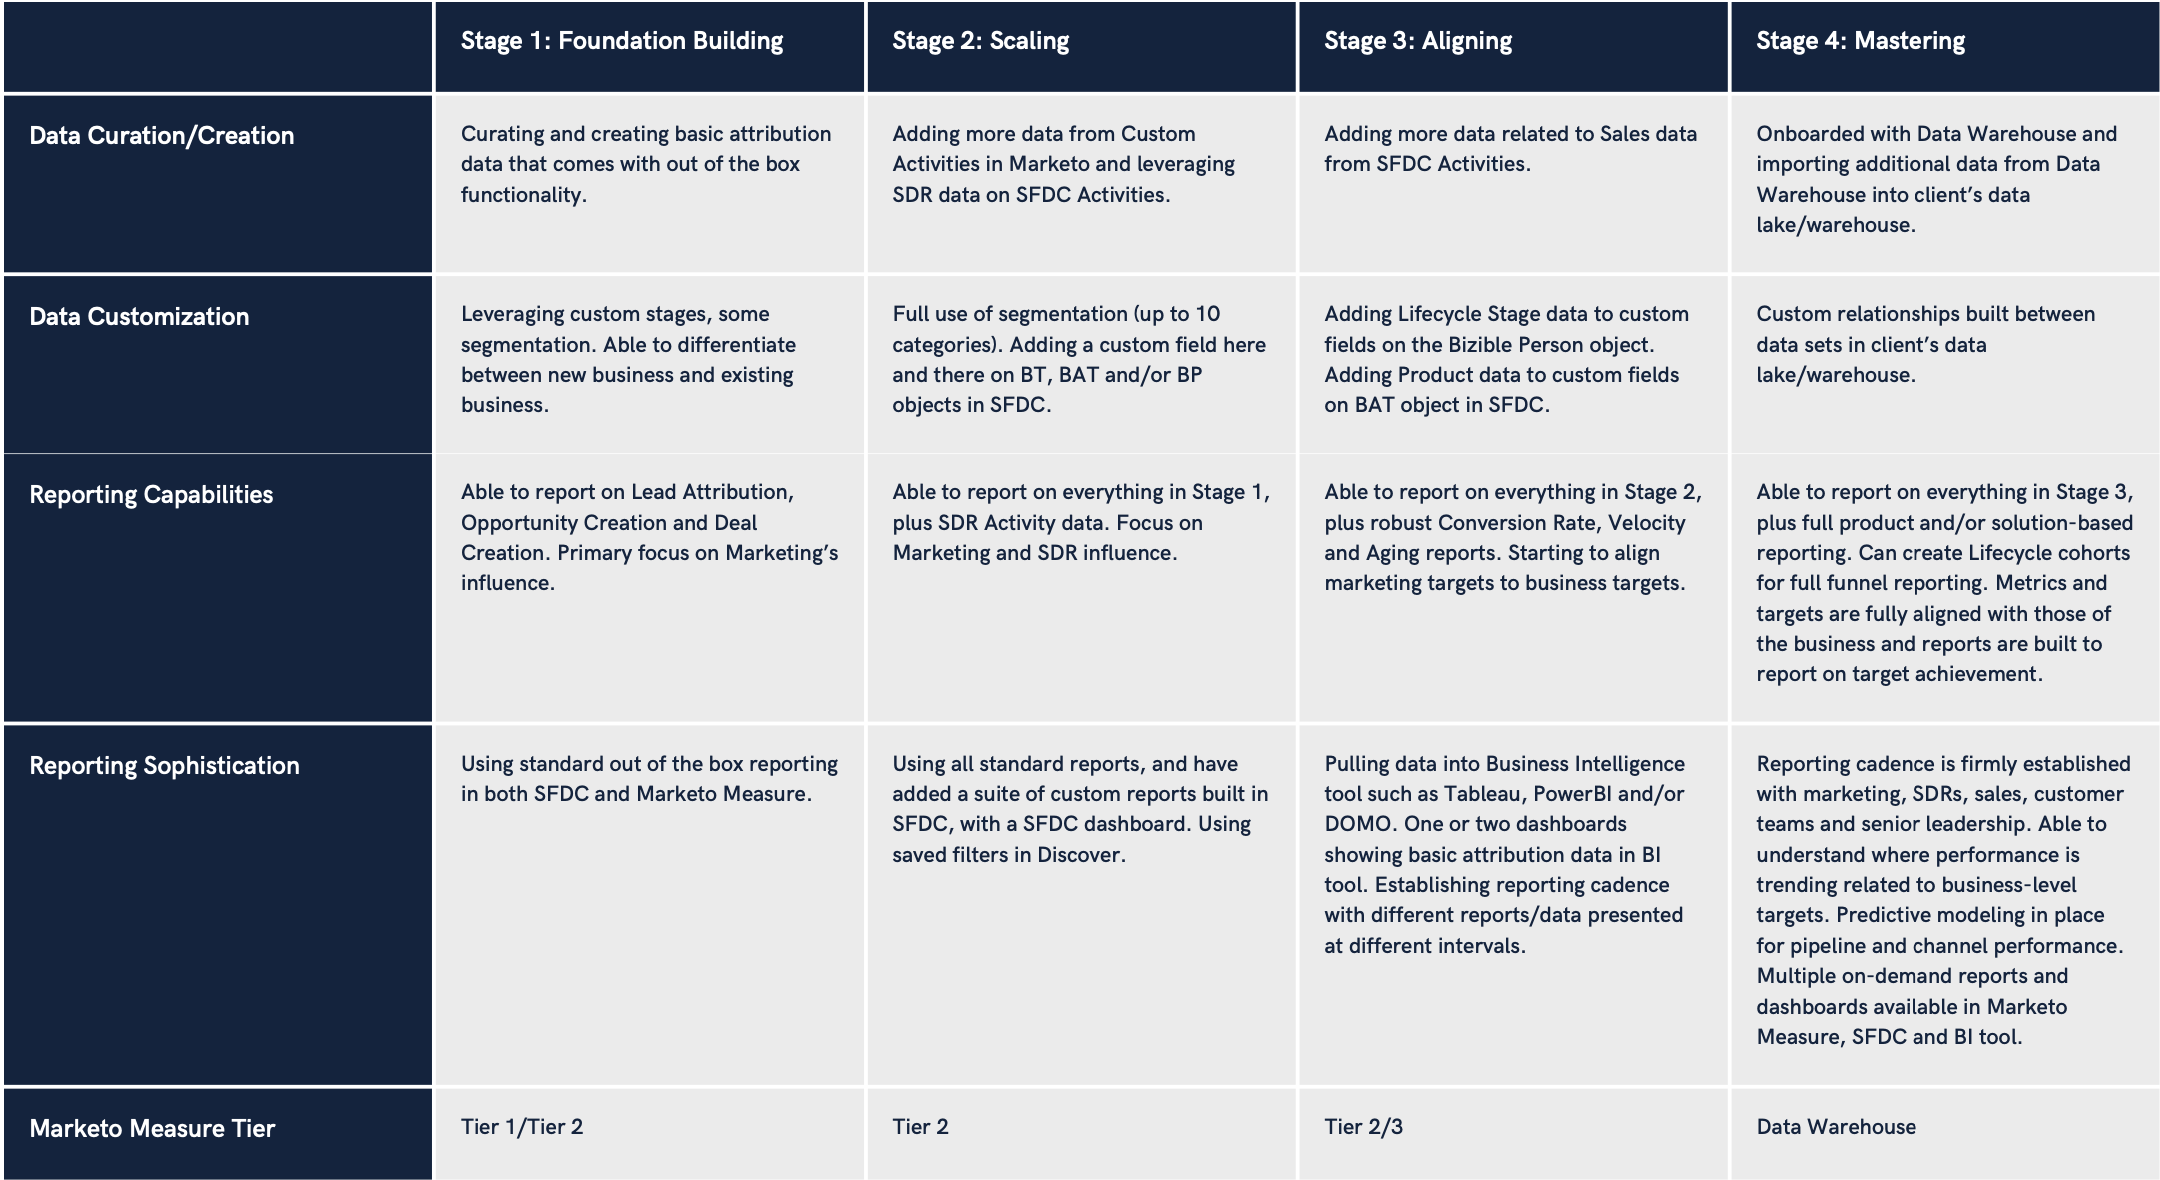
Stage 1: Foundation Building
In this stage, you’re simply building the foundation for a solid reporting ecosystem. You’ve successfully onboarded with Marketo Measure… either Tier 1 or Tier 2 and are using the standard functionality of the tool. You’ve built out some segmentation and added your custom stages (if you have Tier 2). You’re able to do attribution on your leads, to see where they’re coming from. And, you’re able to report on attribution around opportunity creation and deal creation. Your reports are mostly coming from the standard reports and dashboards in SFDC and Discover. Your primary focus for your reporting is on how marketing is performing.
Stage 2: Scaling
In this stage, you’ve started iterating on and improving on your reporting ecosystem. In this stage, you definitely have Tier 2 where you have access to up to 10 segment categories, and you’re using most of those 10. You’re leveraging custom stages in Tier 2. And, you’ve started creating touchpoints from SDR activities in SFDC. In order to improve your reporting capabilities, you’ve started adding some custom fields to the Bizible Person and/or Buyer Attribution Touchpoint custom objects in SFDC. From a reporting standpoint, you’re also now factoring in SDR performance and how SDRs are creating leads and influencing opportunities and deals.
Stage 3: Aligning
Aligning In this stage, you’re starting to align your reporting ecosystem with all of the teams that contribute to revenue. You’re now creating touchpoints from the activities that the sales and customer teams are logging in SFDC. Your lifecycle stages and date stamps for each have been added as custom fields to the Bizible Person object. And, you’ve also added product and solution data to the Buyer Attribution Touchpoint object in SFDC as well. These additions give you way more reporting flexibility and capabilities. Conversion rates, velocity and aging are now a standard part of your reporting suite and we’re reviewing this data on a regular basis. And now that you have this data and are reporting on this data, you’re starting the process of aligning marketing’s KPIs and targets to those of the business. As this stage, you’re also starting to export the SFDC data and Marketing Automation data into a business intelligence (BI) tool such as Tableau, PowerBI or DOMO, and you’ve created your first set of reports and dashboards in that tool.
Stage 4: Mastering
In this final stage, you’ve completely aligned your reporting ecosystem across all revenue teams. You’ve onboarded with the Data Warehouse product from Marketo Measure to give you even more data at your fingertips. And, you’ve combined that data with data from your SFDC and Marketing Automation platform into a data lake/warehouse. With this, you’ve created custom relationships between data sets such as relating the touchpoint and attribution touchpoint data with the products table in SFDC. This enables you to do full product and/or solution-based reporting in your BI tool, so that you can see how your marketing efforts are influencing opportunities and deals with specific products and solutions. You’re also able to do full funnel reporting with lifecycle cohorts. Your marketing, SDR and sales KPIs and targets are fully integrated and aligned with the goals of the business. This means that marketing, SDRs and sales can see if they are on target or off target at any given time. You’ve established a repeatable reporting cadence across the revenue teams and senior leadership with expected data points and information delivered through that cadence. On-demand reports and dashboards are built to support the reporting cadence meaning that senior leaders can access that data as needed outside of the reporting cadence. You’re also able to do predictive modeling that enables you to see down the road how pipeline and deals are trending, and how various channels are predicted to perform.