The Gateway to Predictive Analytics
Once you start getting into marketing analytics, and you start mastering the basics, the concept of predictive analytics will start to creep up. There’s nothing that CMOs and CFOs want more than to plug some dollars into a model that tells them where they’ll get the most bang for their buck. So, it’s inevitable that it’s going to come up.
Predictive analytics is hard though. There’s a number of ways to do predictive analytics, but they mostly require a data scientist that can do things like media mix modeling, regression analytics, and other complex analytics models.
But, that doesn’t mean that you can’t get started. And, the starting point–or the gateway drug–is a metric called “Expected Pipeline”. It’s fairly easy to start calculating, and you don’t need a PhD to get started.
So, let’s break down what this new “Expected Pipeline” metric is, how you can use it, and how to calculate it. We’re going to talk about it through the lens of marketing attribution data, because it’s really compatible with marketing attribution data.
The “What” and the “How” of “Expected Pipeline”
So, what the heck is “Expected Pipeline” and how do I use it? Let’s start with what it is.
“Expected Pipeline” is a metric that tells you how much pipeline you can expect from a marketing investment. It uses prior performance data to predict future data. In plain English, it says, “If I invest X amount of money into this channel/subchannel/campaign, I can expect to return Y amount of opportunity value… or pipeline.” And, as I hinted to above, you can break it down to channels, subchannels, ad campaigns, and even keywords, using your marketing attribution platform. Also, you can create this metric at the touchpoint level (ie marketing engagement) or at the Lead level (leads created). They work similarly.
This metric is the baseline for your predictive analysis.
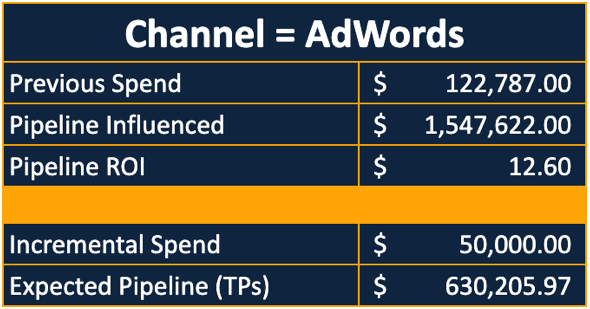
Let’s say you have an extra $50k in marketing budget that is unallocated and unaccounted for. And, you want to know where to put it. You can use the “Expected Pipeline” metric to understand where you’re going to get the best bang for your buck.
Now, I want to pause here… and emphasize that this is a very simple and basic predictive model. It does not control for other outside factors and it does not control for things like when your spend reaches the tipping point and each dollar returns less value than the previous dollar because you’ve already spent the optimal amount. It’s not that sophisticated… which is why I refer to it as the gateway drug… because once you start doing this, you want more and better.
It Starts with ROI
In order to calculate “Expected Pipeline”, you have to start with ROI. But, not the ROI that you’re used to, and not the ROI that is automatically calculated by platforms like Marketo Measure (fka Bizible).
You have to calculate your pipeline ROI. This is calculated similarly to your actual ROI, but instead of focusing on the value of Closed Won deals, it focuses on the value of Opportunities Created… for future reference, we’re going to call this “Created Pipeline”.
So, you start with your “Created Pipeline” for a specific channel, subchannel or ad campaign name. In order for this to work well, you need to pull in a lot of data. So, pull this from not just one year, but multiple years, if you can. Basically, go back as far as you trust the data. From there, you need to understand how much you spent to create that pipeline. Once you have that, you divide “Created Pipeline” by the spend. That’s now your “Pipeline ROI” value.
Next, take the spend amount that you want to evaluate, and multiply that, by the “Pipeline ROI” value above. The result of that, is your “Expected Pipeline”.
This isn’t something that can be done directly inside your marketing attribution platform, or even inside Salesforce. But, it’s fairly simple to do inside Excel, or inside a Business Intelligence tool, like Tableau or PowerBI.
Once you’ve put this together for one channel, subchannel, or campaign, it should be fairly easy to replicate across others. Your marketing attribution platform provides you with all of the data you need… you just need to run the calculations.
What Does This Get You?
It gives you a simple, and basic, predictive model that can be used to try to predict future results based on previous performance.
Again, this is not advanced predictive analytics… this is just the starting point. Get started with this, and then work your way up to more advanced models. But, if you want to get started, and you don’t have a data scientist, and you don’t have the budget to outsource one, this can be a short-term solution until you get to that point.

