

The 5 stages of B2B attribution. From single-touch to AI.
The Marketing Measurement Maturity Model
In short: the marketing measurement maturity model is a five-stage framework that describes how B2B teams evolve from basic single-touch attribution to AI-powered measurement. The five stages are Establishing, Broadening, Unifying, Triangulating, and Amplifying.
Every marketing team wants to know the same thing: what’s actually working? But the honest answer is that most teams can’t answer that question as well as they’d like — not because they lack effort, but because measurement is a capability you build over time, not a switch you flip.
We’ve been in more attribution and measurement conversations than we can count, and the same pattern shows up again and again. Teams reach for the most sophisticated tool or model they can find, hoping it’ll deliver clarity overnight. It rarely does. Measurement maturity is a climb. Each stage builds on the one below it, and skipping steps tends to produce expensive dashboards nobody trusts.
So we built the marketing measurement maturity model to map that climb. It has five stages — Establishing, Broadening, Unifying, Triangulating, and Amplifying — and it tracks each stage across five dimensions: the data sources you draw from, the attribution method you rely on, your funnel reporting capabilities, the tooling you use to analyze it, and the business question you can credibly answer. Use it to find where you are today, see what “good” looks like at the next level, and focus your energy on the specific gap in front of you. The goal isn’t to rush to Stage 5. It’s to be genuinely strong at whatever stage you’re in — and to know what earning the next one requires.
One caveat before we climb: think of these as stages of maturity, not a rigid sequence you have to move through in order. Plenty of teams skip around — you might onboard a media mix modeling vendor before you’ve fully built out Stage 4, or layer AI on top of your Stage 3 data without ever formalizing incrementality testing. That’s fine. The model is a map of what “more mature” looks like, not a set of gates you have to pass through one at a time.
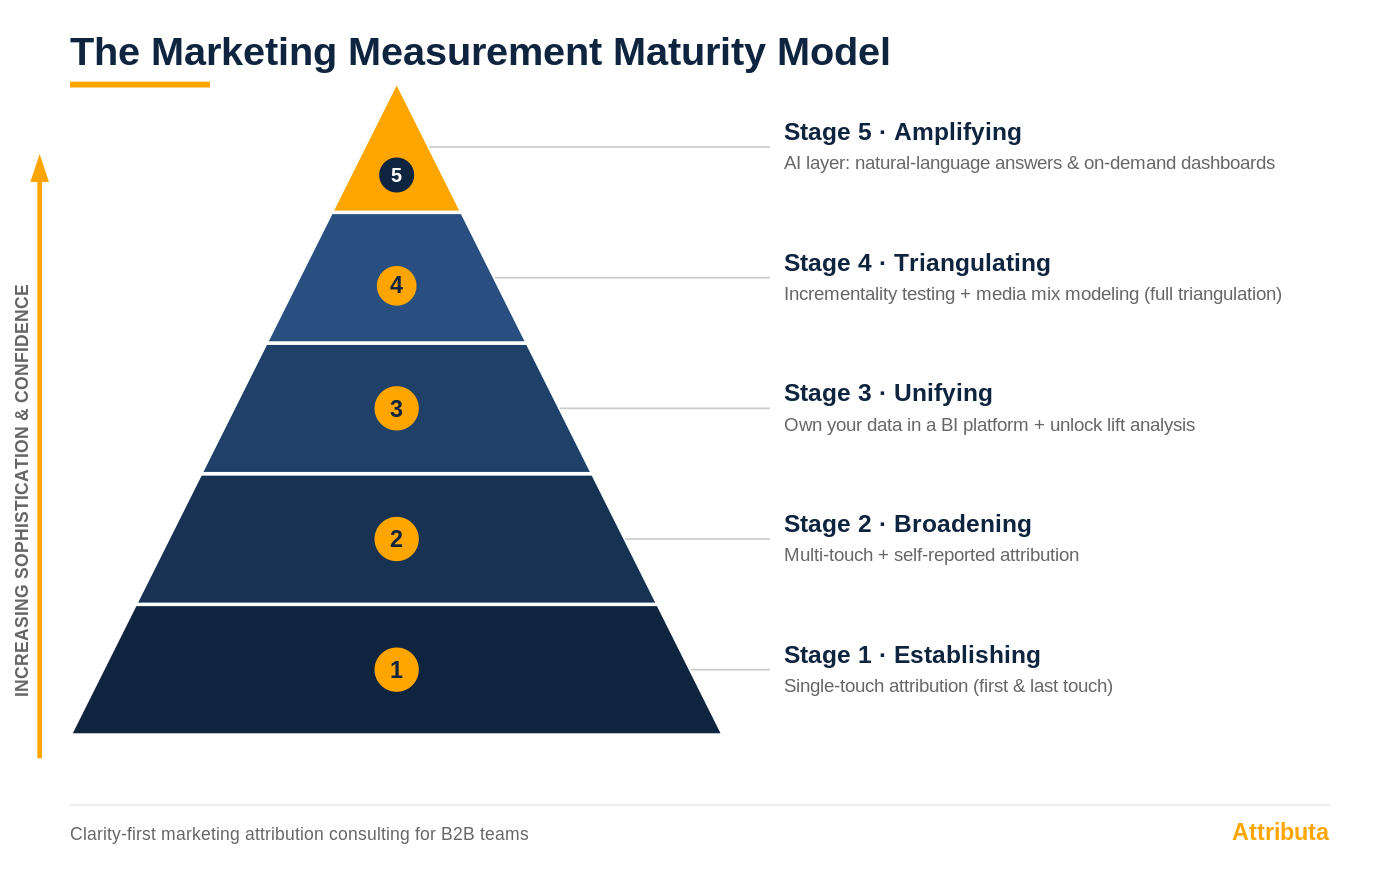
The five stages of the marketing measurement maturity model.
Stage 1 — Establishing: Single-Touch Attribution
Stage 1, Establishing, is the single-touch stage: teams assign every lead, opportunity, and deal a source using first-touch attribution, last-touch attribution, or both. And there’s no shame in starting here.
First touch tells you what brought someone in the door; last touch tells you what was in front of them when they converted. Your data lives in the tools you already own: your marketing automation platform and your CRM, plus whatever native attribution reporting rides along with them. The reports are standard and mostly out-of-the-box, and the focus is simple and useful — how is marketing performing, and where are our leads coming from? Single-touch attribution gets a bad rap, but it’s the foundation. If your sources and UTMs aren’t clean here, nothing you build on top of them will be either.
Funnel reporting at this stage is a snapshot. You can see how many people sit in each stage at any given moment — usually pulled from a single field that records each record’s current stage. It answers “where is everyone right now?” but not how they got there or how fast.
Stage 2 — Broadening: Multi-Touch and Self-Reported Attribution
Stage 2, Broadening, adds multi-touch attribution and self-reported attribution, spreading credit across the many interactions that shape a buying decision instead of crowning a single touch.
Multi-touch attribution stops pretending any one click tells the whole story. Self-reported attribution goes a step further by asking buyers directly — “how did you hear about us?” on forms and in conversations — because some of the most important touches (a podcast, a peer recommendation, a conference hallway) never leave a trackable footprint. Together they give you a far more honest picture of the buyer journey. You’re still working inside your marketing automation, CRM, and attribution tools, but the question you can answer has gotten sharper: not just where leads come from, but which combinations of channels and touches actually move people toward a deal.
Funnel reporting gains its first real depth here, too. Once you’re capturing a timestamp for each stage, you can calculate conversion rates, velocity, and aging across the whole funnel — for a single trip through it. You finally see not just where records sit, but how quickly they move and where they stall. You also get to see which touchpoints happened at which stage, combining the multi-touch attribution data with your funnel data.
A bit of history makes the climb clearer. A decade ago, Stage 2 was the finish line. Multi-touch attribution was as far as most B2B teams aspired to go, and getting there was considered best-in-class. The industry has matured since — what was once the summit is now an early step on a much longer path.
Stage 3 — Unifying: Your Own Data in a BI Platform
Stage 3, Unifying, is where teams pull data out of their point tools and into a business intelligence platform — Tableau, Power BI, Domo, or Looker — to build their own reports on the Stage 1 and Stage 2 data.
At this stage you outgrow the reporting that ships inside your tools. You’re still working with the same underlying data, but now you combine it on your terms and build your own dashboards rather than living inside someone else’s templates. This is where measurement becomes genuinely yours. It also unlocks a new capability: lift analysis. By comparing performance before and after a campaign — or periods with and without a given activity — you can start to see the incremental impact of your marketing rather than just the credit an attribution model assigns to it. Lift analysis doesn’t require formal holdout or control groups, which is exactly what makes it accessible here. Think of it as the gateway to the full incrementality testing that comes in Stage 4 — a meaningful step toward measuring cause, not just correlation.
Funnel reporting expands to handle more than one pass. With two sets of timestamps per stage — first and most recent — you can report conversion rates, velocity, and aging for up to two trips through the funnel. This is also where cohort analysis arrives: group records by when they entered, then compare cohort against cohort to see whether things are genuinely improving over time.
Stage 4 — Triangulating: Incrementality Testing and Media Mix Modeling
Stage 4, Triangulating, adds incrementality testing and media mix modeling (MMM) on top of attribution, reaching full triangulation — three independent methods measuring the same thing.
Incrementality testing uses deliberate, controlled experiments (holdouts, geo tests, on/off tests) to isolate the true causal impact of a channel or campaign. Media mix modeling is a top-down statistical approach that estimates how each channel contributes to outcomes across your whole budget, including the offline and hard-to-track spend that attribution alone can’t see. With attribution, incrementality testing, and MMM all in play, each method covers the others’ blind spots. When they agree, you can act with real confidence. When they disagree, you’ve found exactly the question worth investigating. This is where measurement graduates from reporting into decision-making — where you can defend a budget shift to your CFO and mean it. Be honest about the bar here: many B2B teams never run true incrementality tests, because building and holding back control groups is operationally hard. That’s exactly why the lift analysis you started in Stage 3 carries so much of the weight — it’s the version of this most B2B orgs can actually run.
Funnel reporting becomes complete. With added software or infrastructure to track every pass — not just the first two — you can measure conversion rates, velocity, and aging across an unlimited number of trips through the funnel. Real buyer journeys loop, stall, and re-enter, and this is the first stage where your reporting reflects that instead of flattening it. It’s a genuinely hard problem — and it’s one Attributa is building tooling to solve.
Stage 5 — Amplifying: AI-Powered Measurement
Stage 5, Amplifying, layers AI on top of a mature measurement foundation so teams can ask questions in plain language and get answers — and dashboards — on demand.
Instead of hunting through dashboards, you ask questions in natural language — “which channels drove the most incremental pipeline in EMEA last quarter?” — and get an answer grounded in your own triangulated data. Dashboards get built on demand, shaped to the question at hand rather than pre-baked weeks earlier and slowly going stale. AI surfaces patterns and anomalies you didn’t think to look for, and compresses the time between a question and a defensible answer from days to seconds. Be clear about what this is and isn’t: AI is an amplifier, not a shortcut. It makes a strong measurement foundation faster and more accessible — and it makes a weak one wrong faster. Which is exactly why this stage sits at the top of the climb, not the bottom.
Funnel reporting joins everything else in natural language. You ask how progression looks — “which stage is aging worst for enterprise deals this quarter?” — and get an answer, or a dashboard built on demand, without ever opening a report builder.
One more thing worth saying plainly: this stage is new. A couple of years ago it didn’t meaningfully exist. The rise of AI over the last 12–24 months is what turned on-demand, natural-language measurement from a someday-idea into something teams can actually use today. So Stage 5 is less a place the industry has already arrived and more the frontier it’s now moving toward — which is part of why getting the earlier stages right matters so much.
And because it’s the frontier, getting here is a real differentiator. Outside of very large enterprises with dedicated data science teams, very few organizations are operating at Stage 5 today. Reaching it doesn’t just make you better at measurement — it puts you ahead of nearly everyone you’re competing with.
A note of realism, though: unless you have a strong AI agent engineer on staff (whatever that role is called this year), getting to Stage 5 usually takes outside help. The tooling is new, the patterns aren’t settled, and the distance between a slick demo and a system your team actually trusts is wide. This is exactly the kind of work we do — and if you want a partner to help you get there, Attributa would love to help.
The Five Stages at a Glance
| Stage | Data sources | Attribution method | Tooling | Business question you can answer |
|---|---|---|---|---|
| 1 · Establishing | Marketing automation + CRM | Single-touch (first / last touch) | Native tool reports & dashboards | Where are our leads coming from, and how is marketing performing? |
| 2 · Broadening | Marketing automation, CRM, attribution tool | Multi-touch + self-reported | Native tool reports & dashboards | Which channels and touches actually move buyers toward a deal? |
| 3 · Unifying | Data exported from your existing tools | Multi-touch + self-reported (your model) + lift analysis | BI platform (Tableau, Power BI, Domo, Looker) | What is the incremental impact of our marketing, on our terms? |
| 4 · Triangulating | All of the above + experiment & spend data | Attribution + incrementality testing + MMM | BI platform + experimentation / statistical tooling | What is truly causal, and where should we move budget? |
| 5 · Amplifying | All of the above | Triangulation, queried through AI | BI platform + AI / natural-language layer | Anything you can ask — answered on demand, grounded in your data |
Funnel Reporting by Stage
Funnel reporting is its own dimension of maturity — how deeply you can see people move through your stages, not just where they sit today. Here’s how it evolves stage by stage.
| Stage | Funnel reporting capability |
|---|---|
| 1 · Establishing | A live snapshot — how many records sit in each stage right now, from a single current-stage field. |
| 2 · Broadening | Conversion rates, velocity, and aging across all stages for one trip through the funnel (a timestamp per stage). |
| 3 · Unifying | Conversion, velocity, and aging for up to two trips through the funnel (first + most-recent timestamps per stage), plus cohort-vs-cohort reporting. |
| 4 · Triangulating | The same metrics across every trip through the funnel — an unlimited number of passes — via added software or infrastructure (Attributa is building for this). |
| 5 · Amplifying | Natural-language answers about funnel progression, with AI-built dashboards on demand. |
Frequently Asked Questions
What is the marketing measurement maturity model?
The marketing measurement maturity model is a five-stage framework describing how B2B teams progress from basic single-touch attribution to AI-powered measurement. The stages are Establishing, Broadening, Unifying, Triangulating, and Amplifying, and each one builds on the capabilities of the stage below it.
What’s the difference between single-touch and multi-touch attribution?
Single-touch attribution gives 100% of the credit to one interaction — either the first touch or the last touch before conversion. Multi-touch attribution spreads credit across the many interactions in a buyer’s journey, which gives a more realistic picture of what influenced a deal.
What is self-reported attribution?
Self-reported attribution is data collected by asking buyers directly how they heard about you, usually through a “How did you hear about us?” field on a form or in a sales conversation. It captures influential but untrackable touches — like podcasts, word of mouth, and events — that click-based attribution misses.
What is lift analysis in marketing?
Lift analysis measures the change in results you can attribute to marketing — typically by comparing performance before and after a campaign, or periods with and without a given activity. Crucially, it doesn’t require formal holdout or control groups, which makes it accessible to almost any B2B team. It points strongly toward causation without fully proving it.
What’s the difference between lift analysis and incrementality testing?
Both measure marketing’s incremental impact, but they differ in rigor. Lift analysis looks at change over time — before versus after, or with versus without — without a formal control group, so it’s directional rather than definitive. Incrementality testing uses deliberate holdout or control groups (holdouts, geo tests, on/off tests) to prove causal lift with statistical confidence. In practice, lift analysis is the gateway to incrementality testing: most B2B organizations rely on lift analysis because they don’t build the holdout groups that true incrementality testing requires. If you can create a clean control group, incrementality testing is the stronger method; if you can’t, lift analysis is where you’ll live.
What’s the difference between MTA, MMM, and incrementality testing?
Multi-touch attribution (MTA) tracks individual journeys to assign credit across touchpoints and is best for day-to-day campaign optimization. Media mix modeling (MMM) is a top-down statistical model that allocates budget across all channels, including offline. Incrementality testing runs controlled experiments to prove causal lift. Mature teams use all three together — full triangulation — because each covers the others’ blind spots.
How does funnel reporting change as measurement matures?
Funnel reporting evolves from a simple snapshot — how many records are in each stage right now — to conversion-rate, velocity, and aging metrics once you capture a timestamp for each stage. More mature stages add multi-trip tracking (records that pass through the funnel more than once) and cohort-vs-cohort comparison, and ultimately natural-language questions about funnel progression answered by AI.
Do you need AI to measure marketing performance?
No. AI is the final stage of measurement maturity, not the starting point. It amplifies a strong, triangulated measurement foundation by answering natural-language questions and building dashboards on demand — but applied to weak data, it just produces wrong answers faster.
How do I know which stage my team is in?
Match your current attribution method and tooling to the stages: single-touch only is Stage 1; multi-touch plus self-reported is Stage 2; building your own reports in a BI platform is Stage 3; adding incrementality testing and media mix modeling is Stage 4; and querying it all through AI is Stage 5. Most teams are stronger at earlier stages than they think and weaker at later ones than they’d like to admit.
Where do you go from here?
Find the stage that sounds like you right now — and be honest about it. The point of the climb isn’t to leap to the top; it’s to build each stage solidly enough that the next one holds.
| Not sure where you land, or what your next step actually is? Send us a note. Bringing clarity to exactly this kind of question is what we do. |
